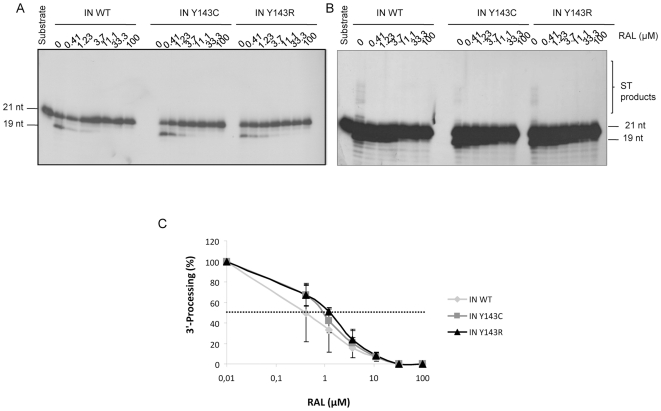
Figure 4. Sensitivity to RAL of IN WT and IN Y143C/R mutants in a 3′-processing assay.
IN (150 nM) was incubated in the presence of increasing amounts of RAL. Then activity was assayed in the presence of a 3′end processing substrate. A typical analysis is shown in Figure 4A (2-hour exposure) and 4B (overnight exposure). Inhibition curves are shown in Figure 4C and are the result of at least three independent experiments.

