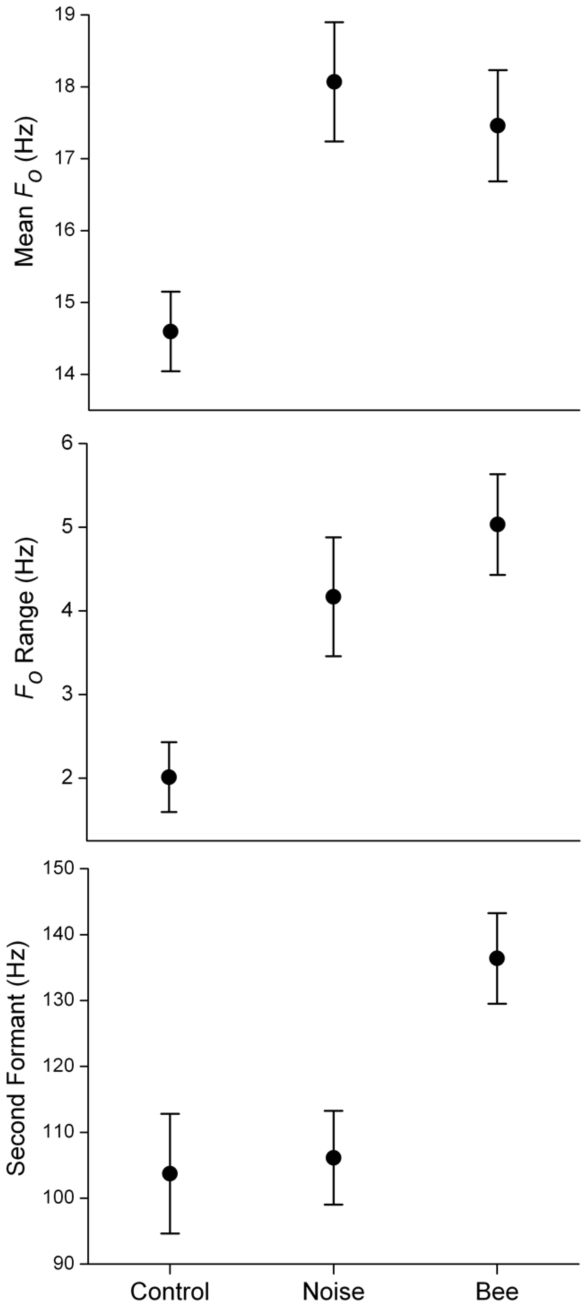
Figure 4. Acoustic features of rumbles emitted in response to sound playbacks.
Mean (±1 SEM) for acoustic features across the three contexts (control = pre-stimulus phases of trials; noise = during stimulus or post-stimulus phases of white noise trials; bees = during stimulus or post-stimulus phases of bee trials). Results of pair-wise tests showed that bee and white noise rumbles were statistically different from controls for mean Fo and Fo range, and that bee rumbles were significantly different from white noise and control rumbles for second formant frequency location.

