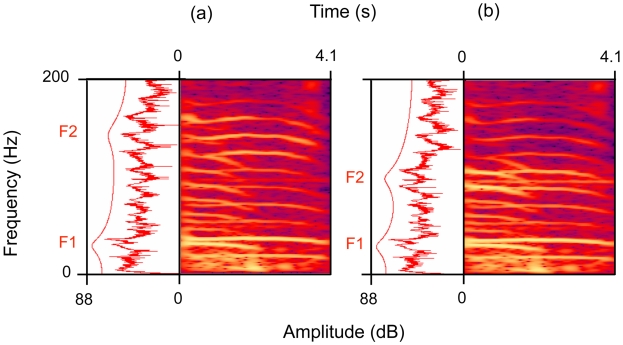
Figure 5. Spectrograms of elephant rumbles.
(a) Unmodified African elephant rumble response to the bee playback stimulus. The Fourier frequency spectrum of the entire signal (PRAAT, version 4.6.18) with LPC smoothing showing two formants (F1, F2) and the spectrogram (44.1 kHz, Hanning window, 16384 bands; Adobe Audition, version 1.5) are shown. (b) Same signal as (a) with the frequency location of the second formants (F2) artificially lowered to match those observed in responses to white noise playbacks (see Materials and Methods).

