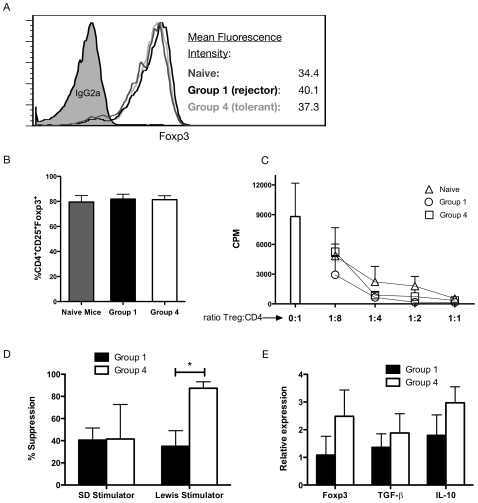
Figure 6. Functional characterization of Treg in rejecting and tolerant mice.
Treg were isolated form the spleen of Group 1 (rejecting mice) at day 10 post transplantation before rejection occurrence and of Group 4 (tolerant mice) at day 20 after tolerance induction. Three mice per Group in 3 separate experiments showed similar mean fluorescence intensity (A) and purity (B) of Foxp3+ cells (gated on CD4+CD25+). Treg of Group 1 and 4 were used at different ratio (1∶1, 1∶2, 1∶4, and 1∶8) in co-culture with syngeneic responders (CD4+CD25+) and stimulators and anti CD3e mAb (C). Treg xenospecificity was assed by co-culture of naive mice splenocytes with donor Sprague Dawley or third party Lewis stimulators plus minus rejector or tolerant Treg. Percentage of suppression are shown (D). Foxp3, TGFβ-1 and IL-10 mRNA expression were measured by real time PCR. Results were calculated on basis of relative mRNA expression compared to naive mice (relative expression = 1, E).

