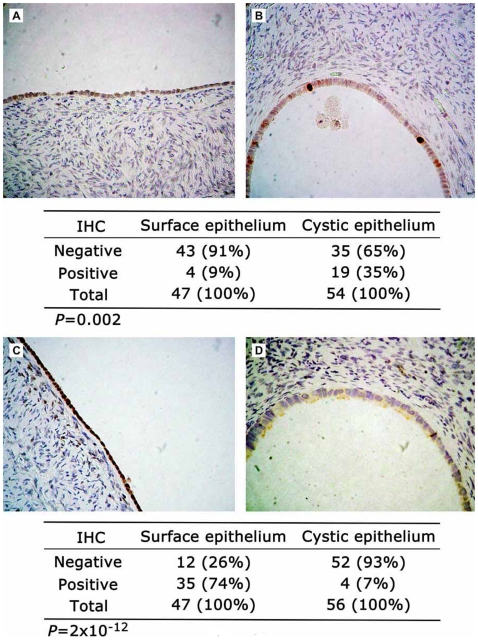
Figure 3. Semiquantitative immunohistochemical analyses of gene products differentially expressed in normal ovarian cystic epithelium and ovarian carcinoma compared to normal ovarian surface epithelium.
(A) Normal ovarian surface epithelium displaying negative immunstaining for TOP2A. (B) Normal ovarian cystic epithelium displaying strong immunopositivity for TOP2A in two cells. (C) Normal ovarian surface epithelium displaying immunopositivity for FOS in all cells. (D) Normal ovarian cystic epithelium displaying negative immunostaining for FOS. Indicated under each pair of photomicrographs are the proportions of immunopositive and immunonegative cellular compartments for the indicated number of ovarian specimens, with the associated P-values.

