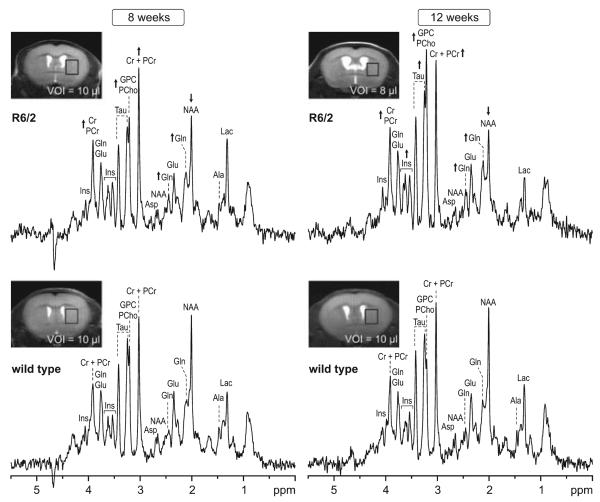
Fig. 1.
Representative in vivo 1H NMR spectra measured from striata of Huntington's disease transgenic R6/2 and wild type mice at 8 and 12 weeks of age. Insets: MR images with the selected volume of interest centered rostrocaudally at the level of the anterior commissure. Arrows indicate changes of a specific metabolite in R6/2 mice relative to age matched WT control. STEAM, TE = 2 ms, TR = 5 s, NT = 160. Processing: Gaussian multiplication (σ = 0.085 s), FT and zero-order phase correction. No water signal removal or baseline correction was applied.

