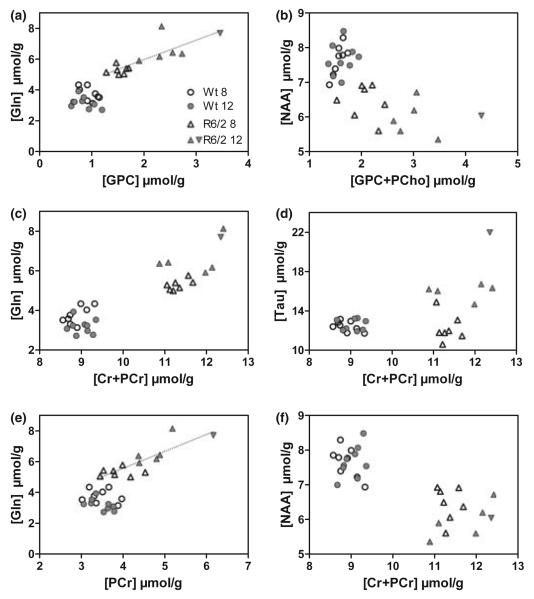
Fig. 4.
Scatter plots of selected metabolite concentrations quantified from individual mice distinguished between R6/2 and wild type at 8 and 12 weeks of age. For the R6/2 data, dotted lines represent correlation between Gln and GPC (a; r = 0.81, p = 0.0008), Gln and PCr (e; r = 0.84, p = 0.0003), Gln and Tau (not shown, r = 0.82, p = 0.0006). To illustrate the ability to track individual animals, values from one particular R6/2 mouse are highlighted with an inverted, filled triangle.

