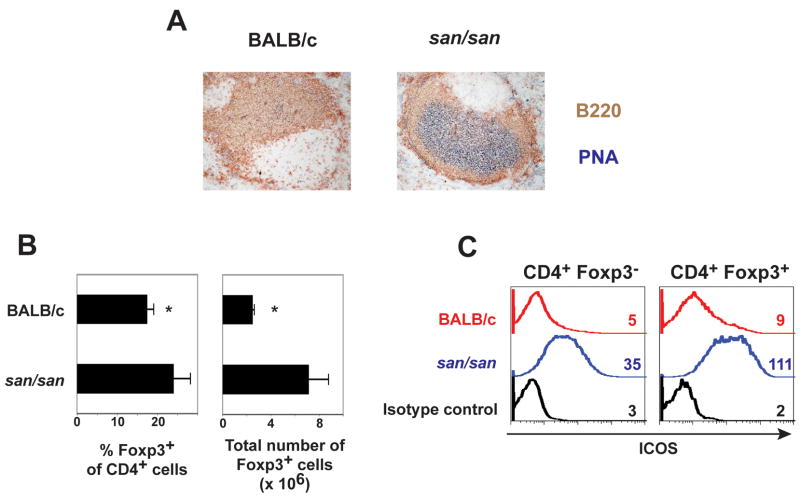
Figure 1.
Phenotype of BALB/c Roquinsan/san (san/san) mice A) This is representative immunohistochemical staining of the spleen showing B220 to mark B cells, and PNA to identify germinal centers (n=3). B) The graphs show the average percentage +/− standard deviation of Foxp3+ cells versus total CD4+ T cells (left) (n=5) and average total number of Foxp3 +/− the standard deviation in the spleen of the indicated mice (n=3). C) Graphs depict the ICOS expression levels on splenic CD4+ Foxp3− and CD4+ Foxp3+ T cells. The numbers designate the geometric mean fluorescence intensity. Data from one of three independent experiments with similar results are shown.

