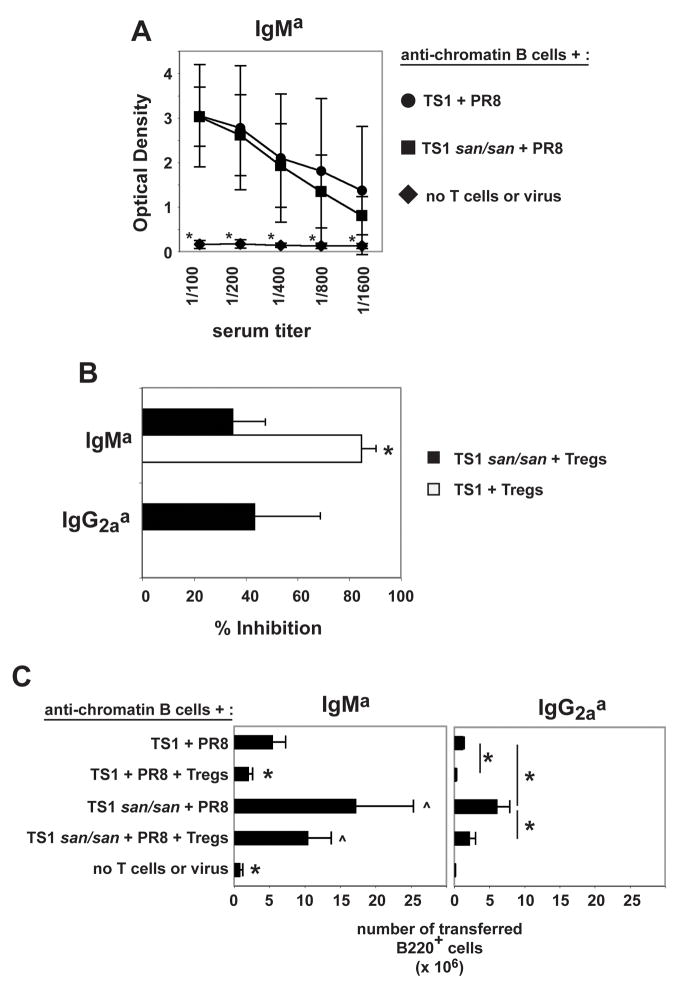
Figure 4.
TS1 and TS1.Roquinsan/san T cells induce anti-chromatin antibodies at day 8. Treg cells completely block this in the context of TS1 T cells, but only partially block with TS1 Roquinsan/san T cells. A) The graph shows the average optimal density +/− the standard deviation of the indicated serum titer of three independent experiments. (*) indicates that the serum titer of the group is significantly different compared to all other groups (n=3). B) The graphs show the average percent inhibition +/− the standard deviation of the 1/100 diluted serum anti-chromatin IgMa from mice that received TS1 + Treg cells (white) or TS1.Roquinsan/san Th + Treg cells (black). The % inhibition of IgG2aa anti-chromatin by Treg cells is shown for the TS1 Roquinsan/san T cells only as the TS1 did not induce IgG2aa anti-chromatin antibodies. (*) indicates that the serum titer of the group is significantly different compared to all other groups (n=3). C) The graphs show the average IgMa and IgG2aa B cell recovery +/− the standard deviation in the spleen. (*) denotes significant difference to all groups (IgMa graph) or the specified groups (IgG2aa graph) (p < 0.05). The (^) marked groups are significantly different from all other groups but not from each other (n=3). No IgG1a B cells were detected in any of the groups tested (data not shown).

