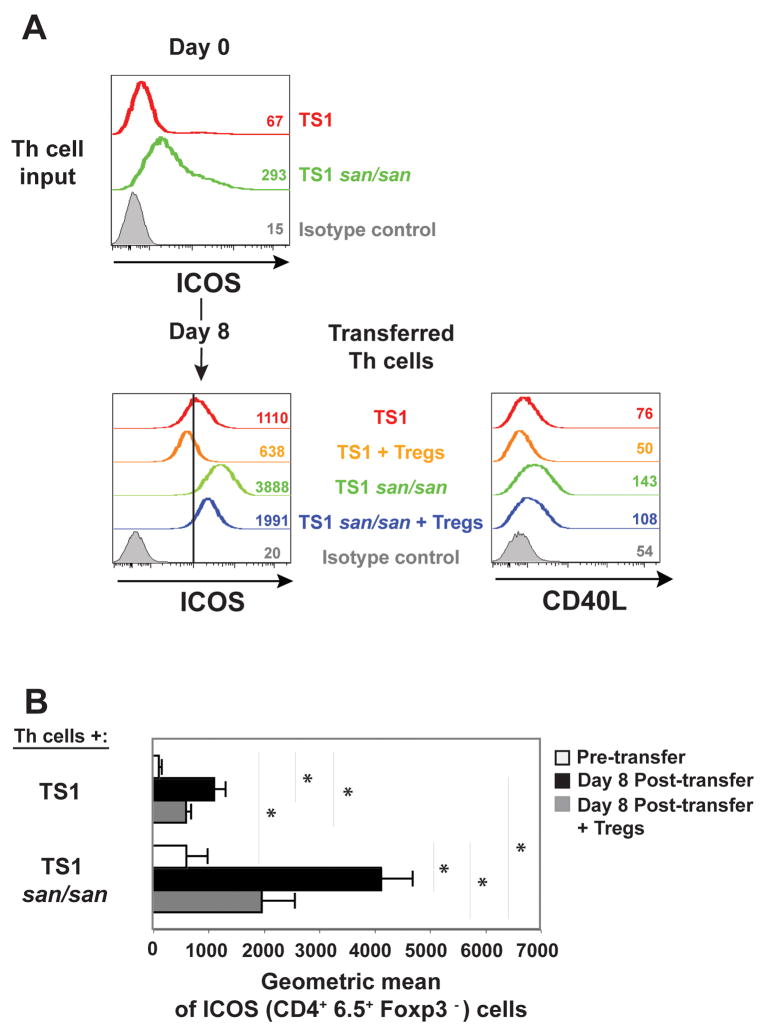
Figure 6.
ICOS and CD40L expression on the transferred CD4+ Th cells. A) ICOS expression on CD4+ Foxp3− cells pre-transfer (day 0) as well as ICOS and CD40L expression at day 8 post-transfer in the spleen on the indicated T cell populations. The numbers are the geometric mean fluorescence of the lines in the graph shown. For a reference point the black vertical line marks 1000 on the x axis of the histogram showing ICOS expression. The data are from one experiment that is representative of three independent experiments. B) The graph shows the average geometric mean for surface ICOS expression +/− the standard deviation on the CD4+ 6.5+ FoxP3− cells at either day 0 or day 8 (n=3).

