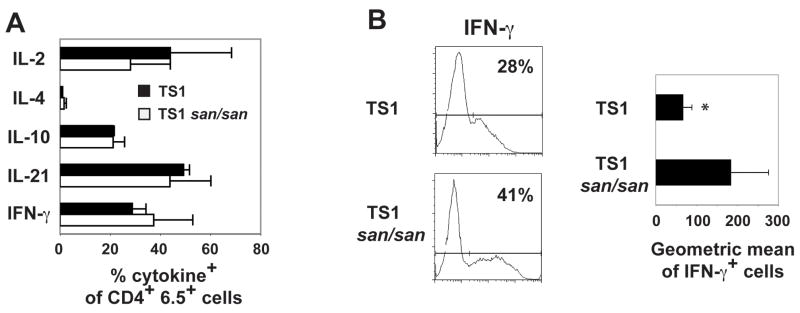
Figure 7.
Intracellular cytokine production. A) The graph represents the average percent positive of the indicated cytokine +/− the standard deviation in the CD4+ 6.5+ T cell population (IL-2, n=3; IL-4, n=3; IL-10, n=2; IL-21, n=3; IFN-γ, n=3) at day 8 post-transfer. B) Representative histogram of IFN-γ and the graph shows the average geometric mean +/− the standard deviation of the IFN-γ+ cells from all experiments (n=3).

