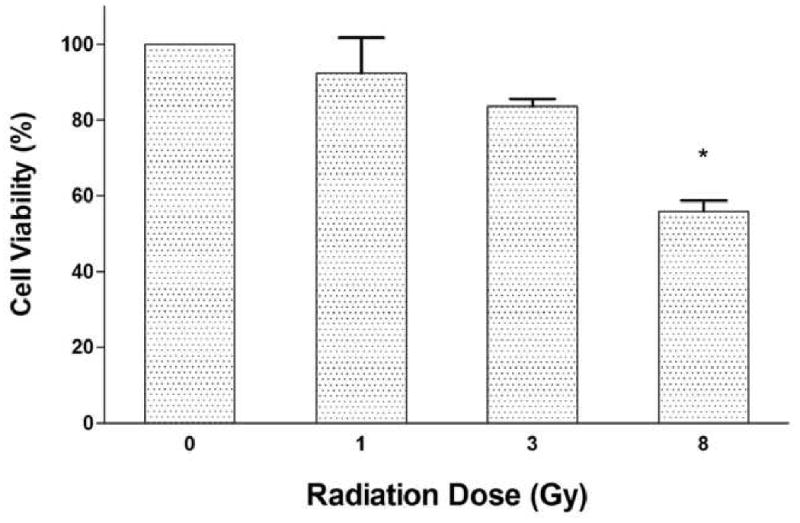
Figure 6.

Result of the MTT cell viability assay. Cell viability decreased dose-dependently. Difference was statistically significant at 8 Gy (p<0.05). The x axis shows the radiation dose, the y axis shows the ratio of the viability. Each value is mean ± SEM.
