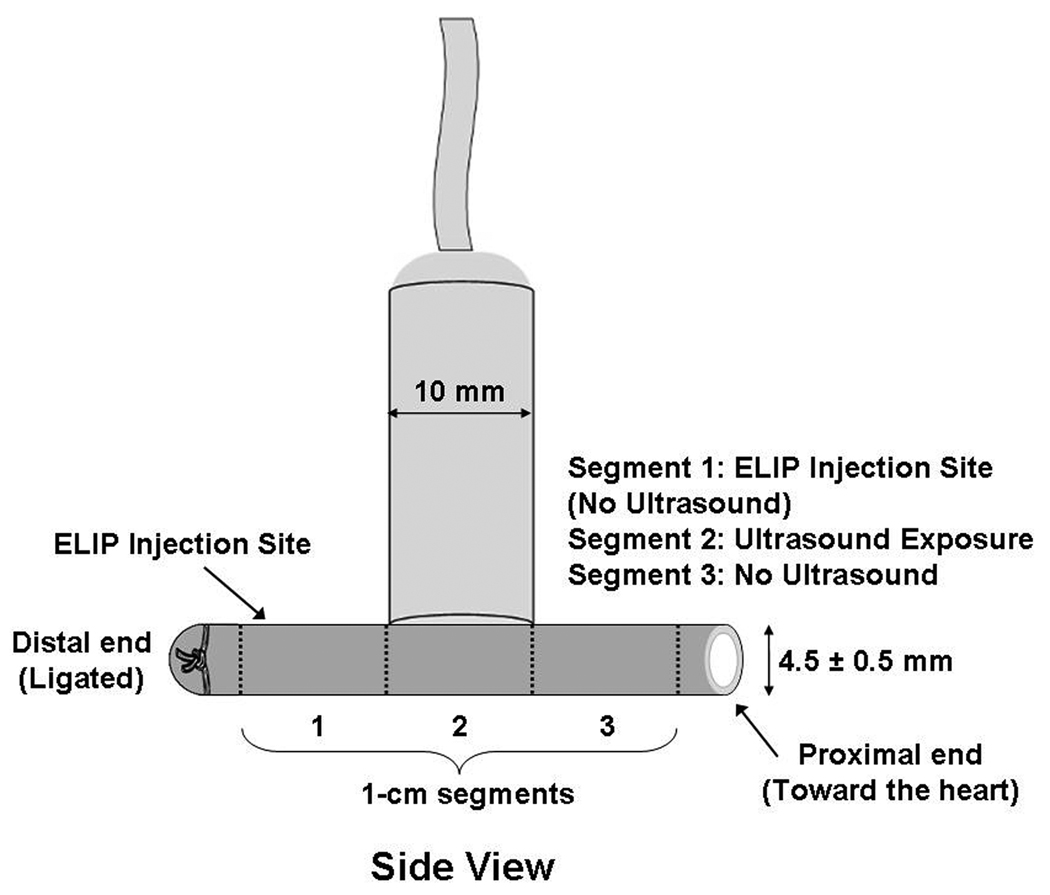
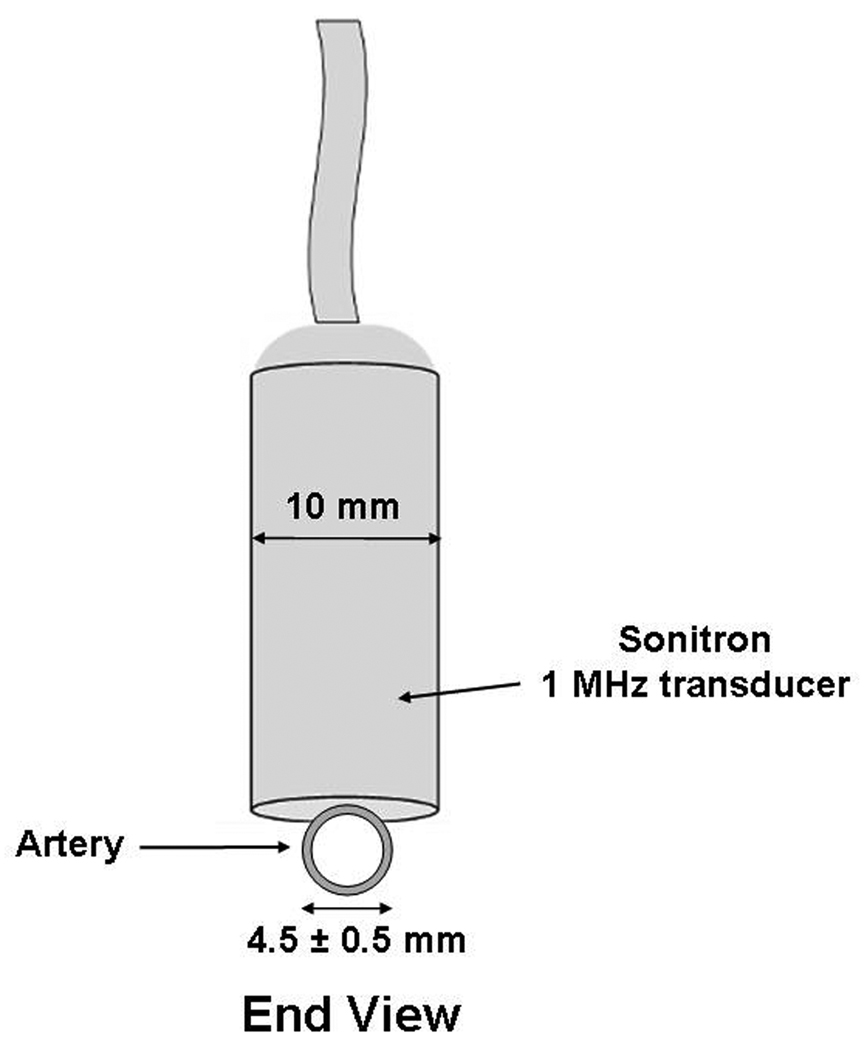
Figure 1.
Transducer position during intraoperative exposure of the arteries, including segmentation of the artery for analysis (1 cm segments). Segment 1 represents the area of ELIP injection (the arrow refers to the injection site); Segment 2 represents the portion where ultrasound treatment was delivered; and Segment 3 represents the portion of the artery which was untreated by ultrasound. (A) Side View; (B) End View.


