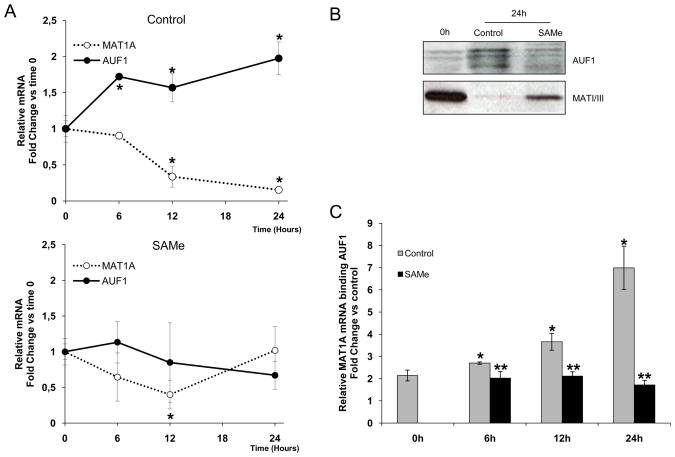
Figure 3.
MAT1A expression during de-differentiation of cultured hepatocytes. A) MAT1A mRNA expression in rat hepatocytes at the indicated times, *p<0.05, time of treatment versus time 0 h. B) Representative Western blot analyses of AUF1 and MATI/III levels in rat hepatocytes undergoing de-differentiation; data are representative of 3 independent experiments. C) RNP-IP analysis of the association of AUF1 with MAT1A mRNA in cytoplasmic fractions of rat hepatocytes incubated as indicated. The enrichment of MAT1A mRNA in AUF1-IPs was calculated as described in Figure 2C. p<0.05, *time of treatment versus time 0 h, **SAMe versus control.

