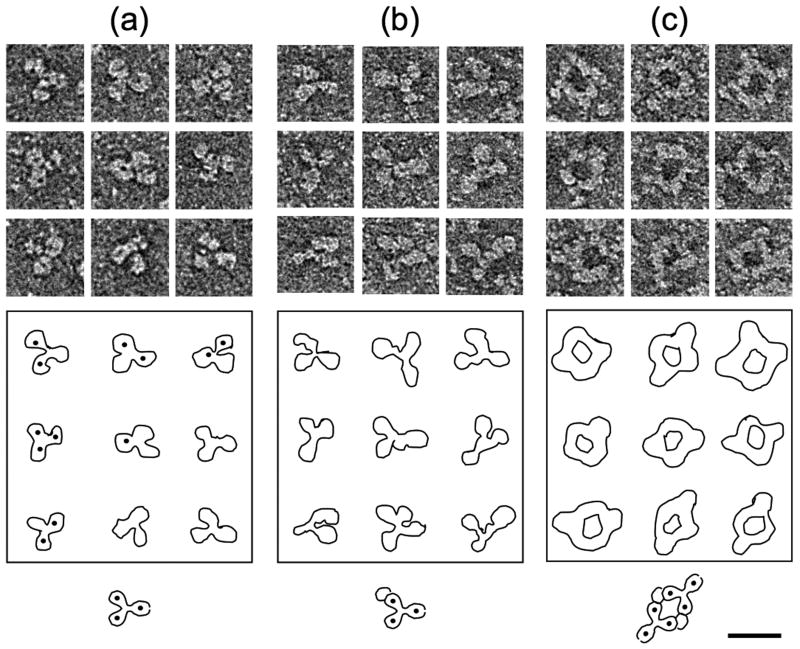
Fig. 4.
Immune complexes visualized by electron microscopy. Cp(-10)149d were mixed with antibodies in solution and visualized in negative stain. (A) Mab alone, (B) Dimer + Mab 904, (C) Dimer + Mab 905. Outlines and an interpretative diagram are shown in each case. The formation of the circular complexes in (C) suggests the presence of two copies of the 905 epitope per Cp(-10)149d molecule. Very similar complexes were observed when Mab e6 was employed (not shown). Bar = 200 Å.

