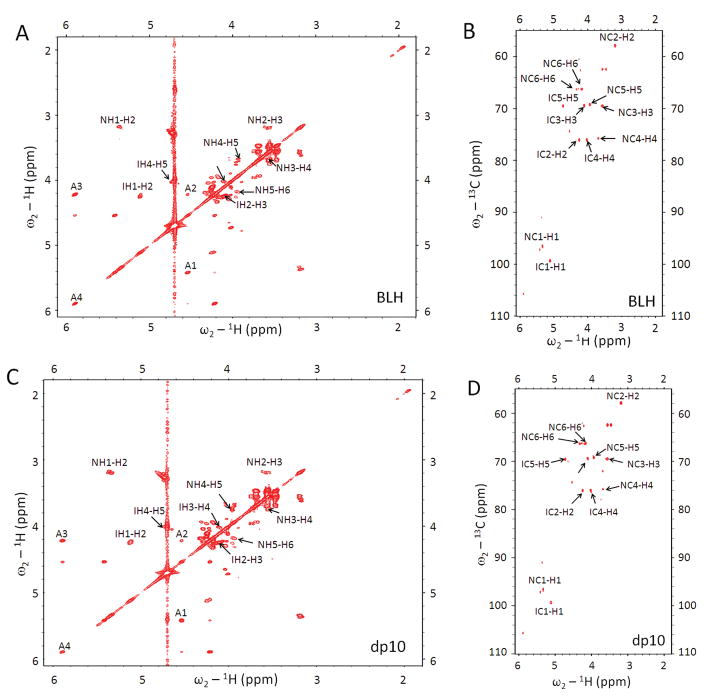
Figure 4.
Two-dimensional NMR analysis of BLH oligosaccharide mixture (A, B) and CE-PAGE purified BLH decasaccharide, dp10 (C, D). The NMR peaks corresponding to H-H (COSY, panels A,C) or H-C (HMQC, panels B, D) correlations are labeled N for GlcN and I for IdoA residues, and A for non-reducing end unsaturated uronic acid residue.

