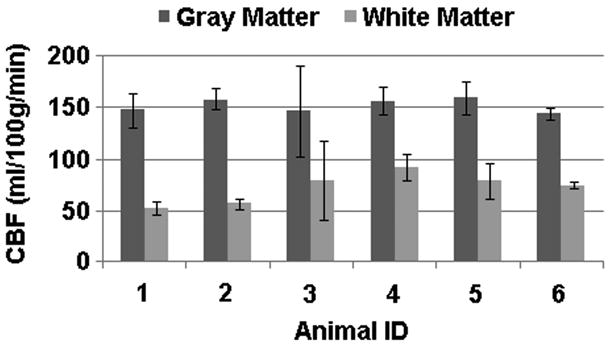
FIGURE 4.

Calculated CBF values for six rats. Error bars represent the standard deviation over all the slices. Mean CBF values were 152.5 ± 6.3 ml/100g/min for gray matter and 72.3 ± 14.0 ml/100g/min for white matter. Representative images in Fig. 3 correspond to animal ID 4.
