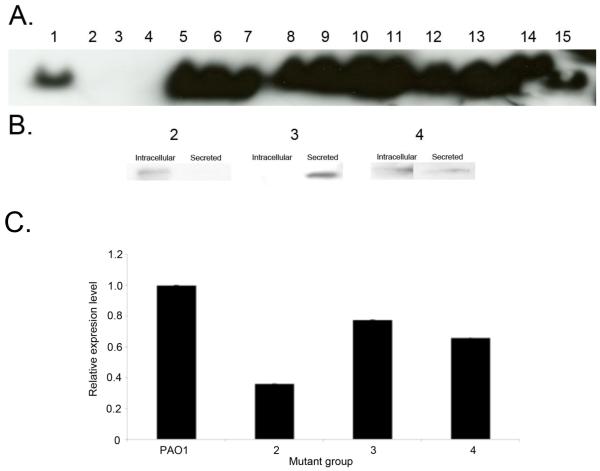
Fig. 3.
A. Native immunoblot analysis of representative strains of the PcrV NSS groups. B. Denaturing immunoblot analysis of intracellular and secreted PcrV fractions using increased total protein concentrations (30 μg) from representative strains of groups 2, 3 and 4. Western analysis results are representative of at least two independent experiments. C. Comparative Q-PCR analysis of relative pcrV expression [compared to pcrV expression of PAO1 (group 1)] by representative strains from mutant groups 1-4. Results are representative of three independent experiments carried out in triplicate.

