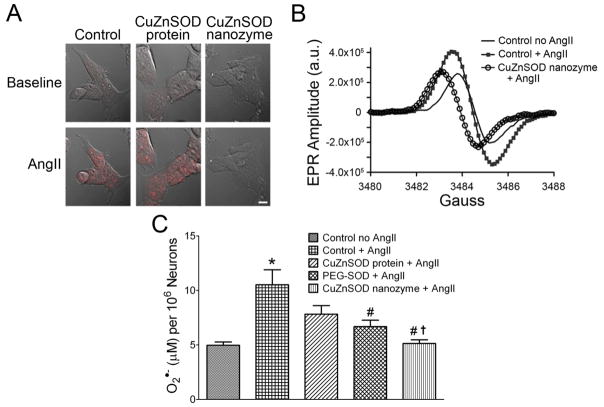
Figure 3. CuZnSOD nanozyme inhibits the AngII-induced increase in O2•− levels in CATH.a neurons.
(A) Representative confocal microscopy images showing DHE fluorescence in non-treated control, free CuZnSOD protein-, and CuZnSOD nanozyme-treated CATH.a neurons before (baseline) and after AngII (100 nM, 20 min) stimulation. Magnification bar equals 10 μm. (B) Representative CMH-EPR spectra obtained from control CATH.a neurons, AngII (100 nM) stimulated neurons, and CuZnSOD nanozyme-treated neurons stimulated with AngII. a.u. = arbitrary units. (C) Summary EPR spectroscopy data showing O2•− levels in CATH.a neurons with and without AngII, and in CATH.a neurons incubated with CuZnSOD protein, PEG-SOD, or CuZnSOD nanozyme followed by AngII stimulation (n=9). *p<0.05 vs. control no AngII; #p<0.05 vs. control + AngII; †p<0.05 vs. free CuZnSOD protein + AngII.

