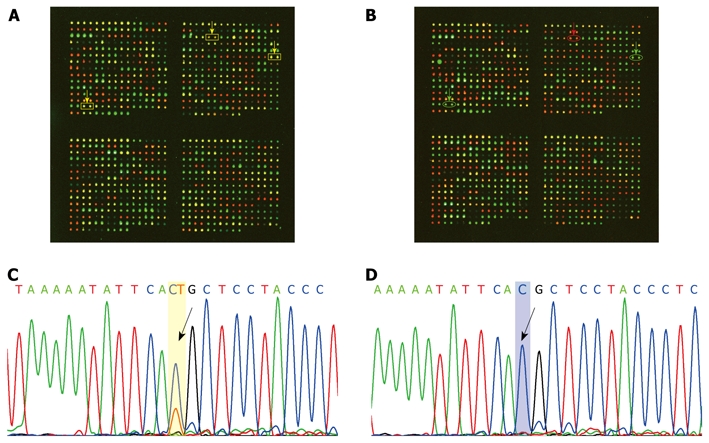
Figure 1.

Representative case showing loss of heterozygosity. A: Informative normal adjacent tissue in SNP array. Yellow arrow shows the SNP loci with heterozygous genotype; B: Corresponding tumor tissue in SNP array. Red (or green) arrow shows the corresponding SNP loci with homozygous genotype; C: Informative normal adjacent tissue in DNA sequencing. Arrow shows the SNP loci with heterozygous genotype; D: Corresponding tumor tissue in DNA sequencing. Arrow shows the corresponding SNP loci with homozygous genotype.
