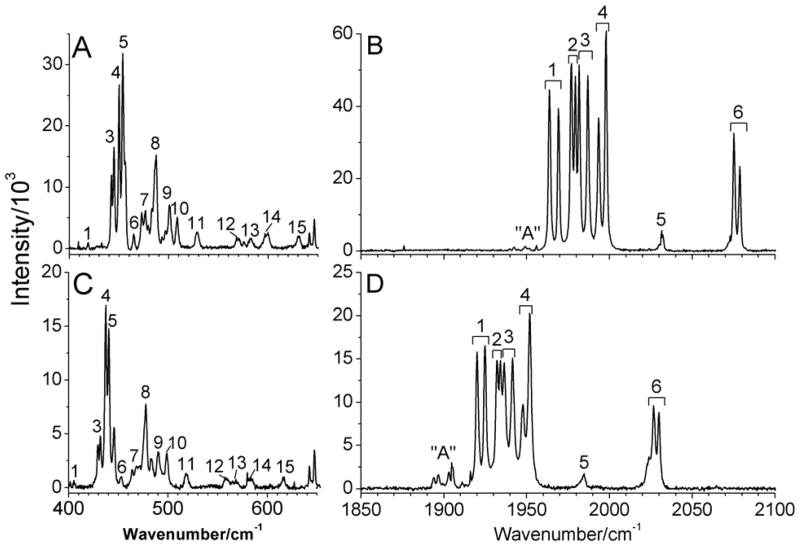
Figure 4.
Raman spectra of solid (μ-edt)[Fe(CO)3]2 (A and B) and (μ-edt)[Fe(13CO)3]2 (C and D) at 77K. The peaks in the spectra are labeled according to the number of modes predicted by group theory in the ν(Fe-CO)/δ(Fe-C=O) and ν(C=O) regions. The spectra were obtained by exciting the samples at 568 nm. Peak “A” is attributed to impurities present in the sample, as indicated by the variable intensity of this feature relative to the signals of (μ-edt)[Fe(CO)3]2 in panels B and D.

