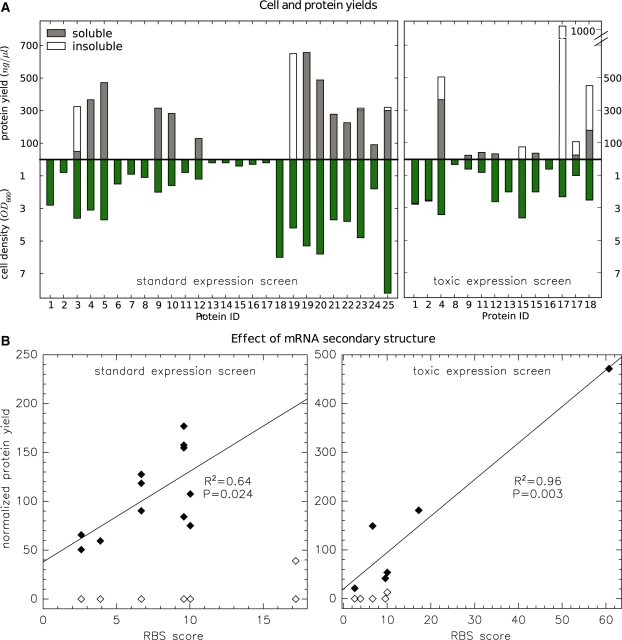
Figure 3.
Protein expression screens. (A) Absolute protein concentrations and cell densities (green) after expression and purification under standard conditions (left) or under conditions optimized for toxic proteins (right). Concentrations in soluble and insoluble fractions are stacked on top of each other. Detailed data are listed in Table 5 and here we only show the clone and condition with highest yield/OD. (B) Control of protein expression by RBS obstruction. Total protein yields from (A) were normalized to cell density (OD) and are mapped against the RBS calculator score (51) reporting on the formation of mRNA secondary structure. Proteins with no or very low expression are denoted by open symbols and were not considered for the linear regression. The protein ID corresponding to each data point is shown in Supplementary Figure S1. The RBS score (here divided by 1000) considers only a sequence window surrounding the translation initiation site and is thus identical for constructs that share the same leading domain. Some constructs with zero expression therefore collapsed into the same data point.

