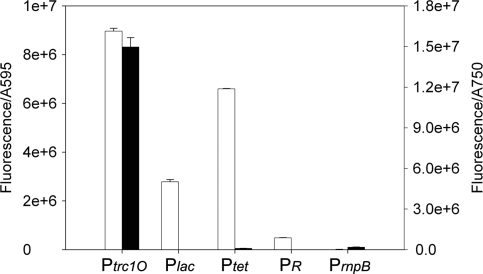
Figure 6.
Specific promoter activities of Ptrc1O, Plac, Ptet, PR and PrnpB in E. coli DH5α (white bar) and Synechocystis sp. strain PCC 6803 cells (black bar). The activities were measured by means of GFPmut3B fluorescence and divided by the absorbance of the cultures at 595 nm (E. coli) or 750 nm (Synechocystis), respectively. The data represent mean ± SD of triple measurements of three independent cultivations.

