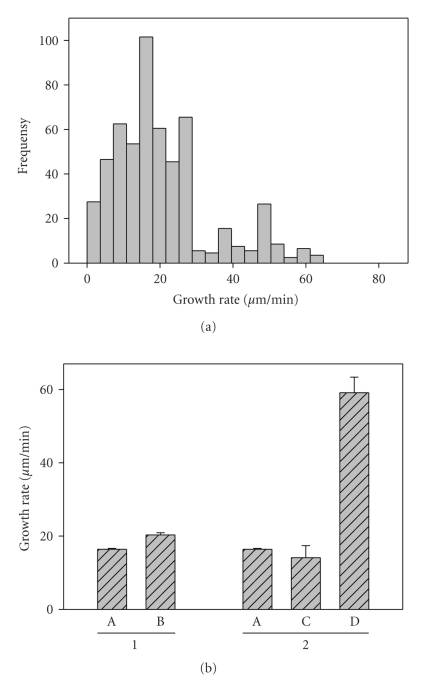
Figure 4.
Microtubule plus-ends growth rate differences in the centrosome region of single cells and cells growing in monolayer. Growing microtubule plus-ends were selectively marked in human EC. HPAEC were transfected with the plasmid expressing EB3-GFP. Persistent microtubule growth was confirmed by long EB3-GFP tracks. EB3-GFP movement was analyzed by time-lapse microscopy. Images were acquired every 1 second. Histogram of microtubule growth rate distribution was obtained by tracking EB3-GFP comets on microtubule tips growing radially from the centrosome region in single human EC (mean growth rate, 20.6 ± 0.6 μm/min (n = 72)) (a). Mean growth rates of microtubule plus-ends in the centrosome region of cells growing in monolayer (A) and in single cells (B); mean growth rates of “normal” (C) and “fast” (D) microtubule plus-ends in single cells (b).

