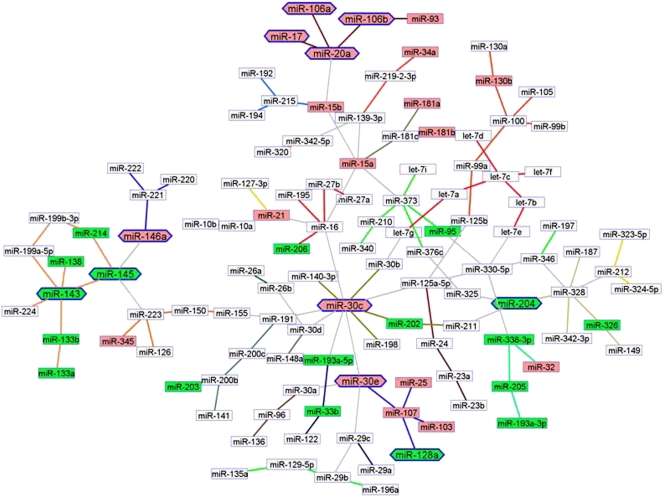
Figure 3.
The miRNA network in solid cancers (2532 samples, 31 cancer types, 120 miRNAs). The network was inferred for all expressed and varying miRNAs, without preselecting for differential expression. Standard Banjo parameters were adopted with a q6 discretization policy. The consensus graph depicted here was obtained from the best 100 nets (after searching through 8.4 × 10⁹ networks). MCL expression clusters are linked by different color edges. yEd graph editor (yFiles software) was employed for graph visualization. The miRNAs expressed differentially in the tumors are color-coded and in the graph miRNA neighbors are of the same color code: Closely clustered miRNAs are either pink (overexpressed) or green (down-regulated). The node labels, for which expression and physical alteration (CGH, see “miRNA copy number variations in cancer and leukemia” section) were concordant (i.e., overexpression and amplification), were emboldened and visually reinforced with a hexagonally shaped border.

