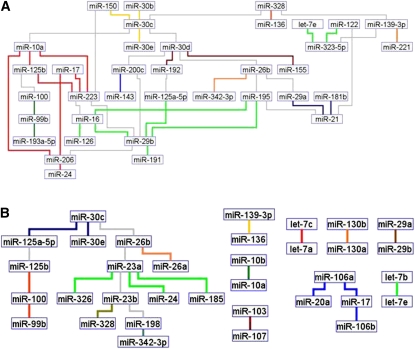
Figure 4.
Comparison of miRNA networks in normal lung and adenocarcinoma. (A) Normal lung (71 samples). A single complete miRNA network is shown. (B) Lung adenocarcinoma (125 samples). In this graph, one major and eight minor subnetworks were detected. For example, hsa-miR-10a/b, hsa-miR-29a/b, hsa-miR-107, and hsa-miR-103 are in minor independent subnetworks disjoint from the main one.

