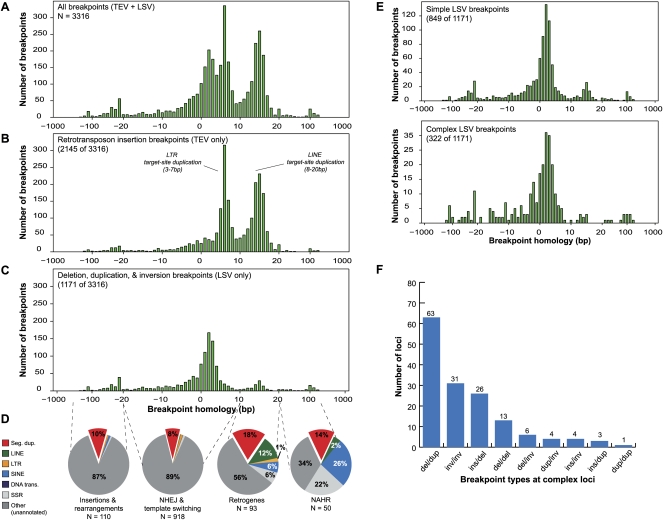
Figure 3.
Characterization of 3316 breakpoint sequences. (A) Histogram of the alignment overlap at all 3316 assembled breakpoint sequences (breaktigs). Positive overlap indicates homology at the breakpoint, while negative overlap indicates the presence of an unaligned segment at the breakpoint, suggesting an insertion or small-scale rearrangement. (B) Histogram of the subset (2145 of 3316) of breakpoints that were determined to be transposon insertions (TEVs) based on TE annotations. Note that the majority of the breakpoints in A showing 3–10-bp and 10–20-bp overlap are explained by target-site duplications from LTR and LINE insertions, respectively. (C) Histogram of the 1171 duplication, deletion, and inversion (LSV) breakpoints. (D) For each of four different ranges (dashed lines) of observed homology at LSV breakpoints, the fraction of breakpoints that overlapped with six different repeat annotations is shown. In all four observed homology ranges, the observed overlap with segmental duplications is higher than the ∼5% null expectation. Whereas breakpoints having little or no homology (two left pie charts) typically only overlapped with SDs, breakpoints having >10 bp of homology overlapped more frequently with SDs and dispersed repeats. (Seg. dup.) Segmental duplications; (LINE) long interspersed nuclear elements; (LTR) long terminal repeats ; (SINE) short interspersed nuclear elements; (DNA trans.) DNA transposons; (SSR) simple sequence repeats. (NHEJ) nonhomologous end-joining; (NAHR) non-allelic homologous recombination. (E) Detailed histograms of C reflecting simple and complex LSV breakpoints, respectively, as defined in the text. (F) The distribution of observed combinations of breakpoints (at least one breakpoint of each type at a given complex locus) at complex loci. (del) Deletion; (dup) duplication; (ins) insertion; (inv) inversion.

