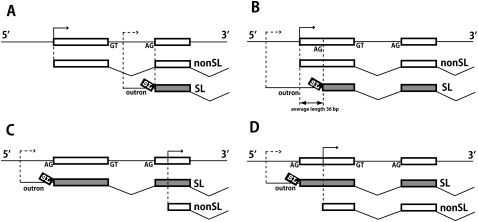
Figure 5.
Production of both trans-spliced and non-trans-spliced mRNAs from individual genes. Each panel depicts one of four gene expression patterns observed. The top line in each panel illustrates the genomic exon organization of the 5′ part of the gene, with transcription starts shown as arrows. Below each genome depiction are lines showing trans-spliced (SL) and non-trans-spliced (nonSL) pre-mRNAs, and indicating their cis- and trans-splicing patterns. Transcription start sites for non-trans-spliced mRNAs (solid arrow) are precisely mapped from 5′-RACE data (Satou et al. 2006). Transcription start sites for trans-spliced mRNAs (dashed arrow) are not precisely mapped, but must be located upstream of the trans-splice acceptor sites (identified in this study). Note that in C and D the trans-spliced and non-trans-spliced mRNAs must be generated from different promoters. In A and B, a one-promoter hypothesis is not ruled out, but the two-promoter hypotheses illustrated are plausible, based on previous studies of Caenorhabditis genes (Choi and Newman 2006) and on the very short outron lengths a single-promoter hypothesis would require to explain the pattern in B in many cases. The data were derived from a set of 107 genes that were represented among the non-trans-spliced oligocap 5′-RACE ESTs reported in Satou et al. (2006), and also among Category 1 reads in this study. Some of these genes generated more than two mRNA types, and thus displayed more than one of four patterns; the number of occurrences of each pattern in the whole set of 107 genes is: (A) 49; (B) 38; (C) 15; (D) 20.

