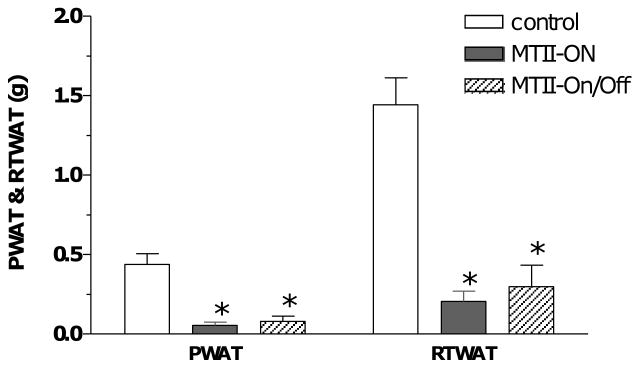
Figure 3.
End point PWAT and RTWAT tissue mass. P < 0.0001 by one-way ANOVA with MTII treatment. By Post Hoc analysis, MTII-On animals had significantly less PWAT or RTWAT than the Controls (* p < 0.001), as did the MTII-On/Off animals versus the Controls (* p < 0.001). There was no statistical difference in adiposity between MTII-On versus MTII-On/Off groups. Note, PWAT was completely depleted in two out of five animals in the MTII-On group and one out of the five animals in the MTII-On/Off group.

