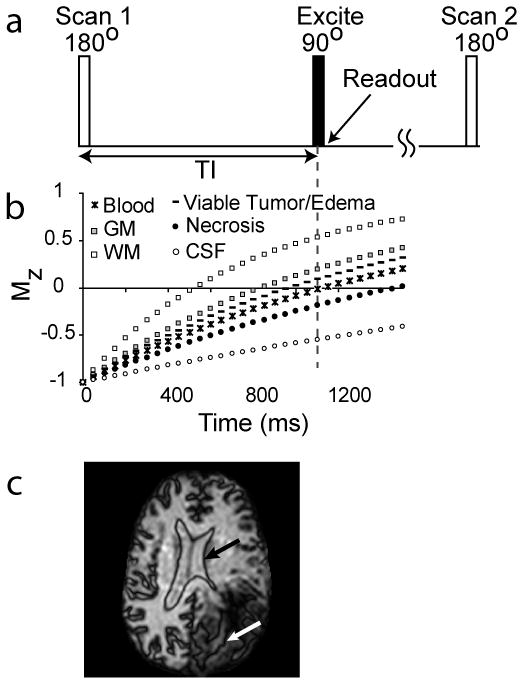
Figure 1.

The VASO pulse sequence (a) consists of a spatially nonselective adiabatic inversion followed by imaging at an inversion time (TI) when blood water magnetization is nulled. The T1 recovery curves for healthy gray matter (GM) and white matter (WM), estimated viable tumor and edema, blood, predicted necrosis, and CSF are shown in (b). At the TI for blood nulling, healthy WM signals are positive, while areas with viable tumor (including some edema and increased CBV) generally appear dark, although this may vary with individual and tumor grade. Necrosis and CSF signals (including cavity fluid) are negative due to long T1 here. Therefore, when magnitude VASO images are displayed, a dark line will surround the CSF/parenchyma boundary (c, black arrow) as well as the necrosis/parenchyma boundary (c, white arrow).
