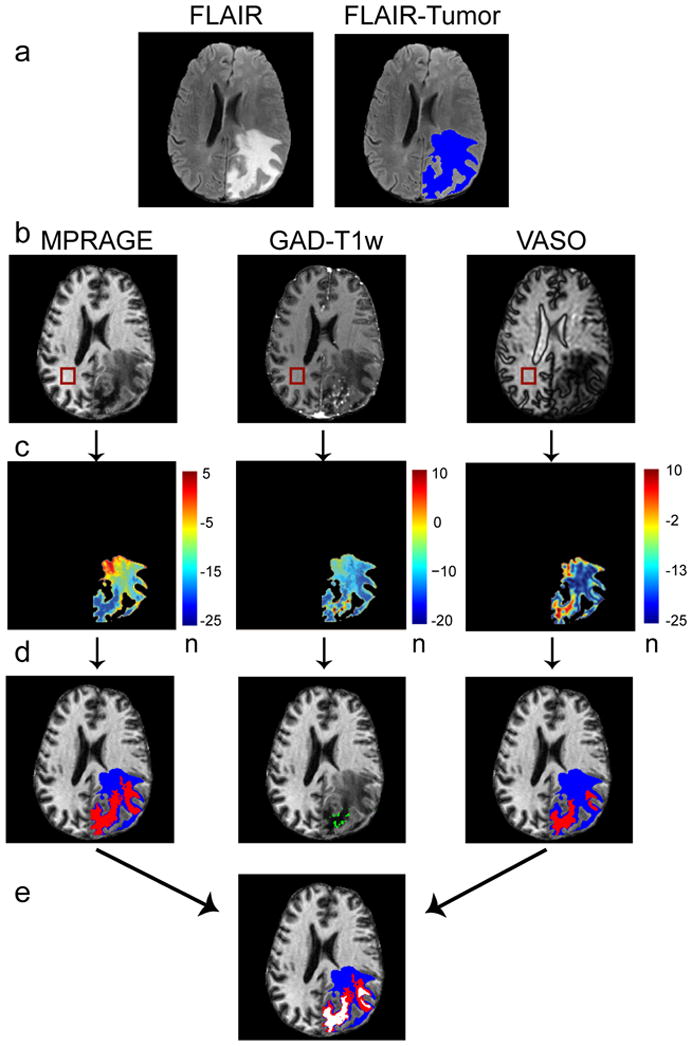
Figure 2.

Method for automated tumor segmentation. First row, the maximum area of tumor plus edema is identified by segmenting the FLAIR image (a, blue). Second row, a corresponding ROI is drawn within healthy white matter in the MPRAGE, GAD-T1w and VASO images and the mean signal intensities and standard deviations are recorded (b). Third row, n-maps are generated that reflect the number (n) of standard deviations each FLAIR-masked tumor voxel differs from mean healthy white matter signal intensity (c). Fourth row, thresholds and region growing procedures are applied to segment regions of abnormal intensity (d). The VASO and MPRAGE images are segmented into long-T1 (red) and remaining volume from FLAIR (blue). Fifth row, for improved consistency, overlapping regions in the MPRAGE and VASO image are identified for a final segmentation of predicted-long-T1 (white) and surrounding regions (e).
