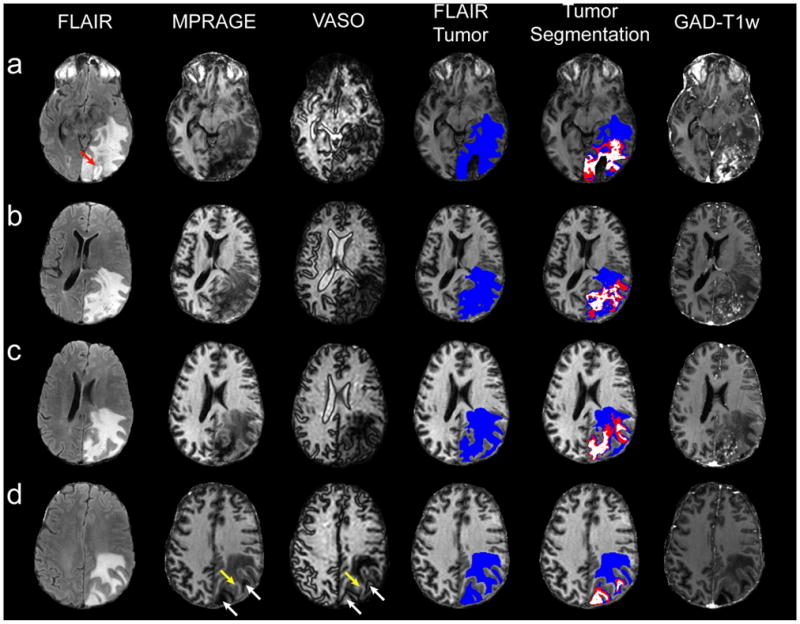
Figure 3.

Four representative slices from a single patient with a GBM. Notice the red arrow pointing to the exluded, radiologically-confirmed resection cavity in the first FLAIR image (a). Volume segmentation for the maximum tumor area (FLAIR, blue) and long-T1 zone (combined VASO/MPRAGE, white) is shown in the fourth and fifth columns. The red region represents long-T1 predicted by either MPRAGE or VASO, but not both. In (d), white arrows on the MPRAGE and VASO images point to long-T1 tumor sections, putatively assigned to necrosis (see discussion) whereas yellow arrows point to healthy white matter.
