
Fig. 1.
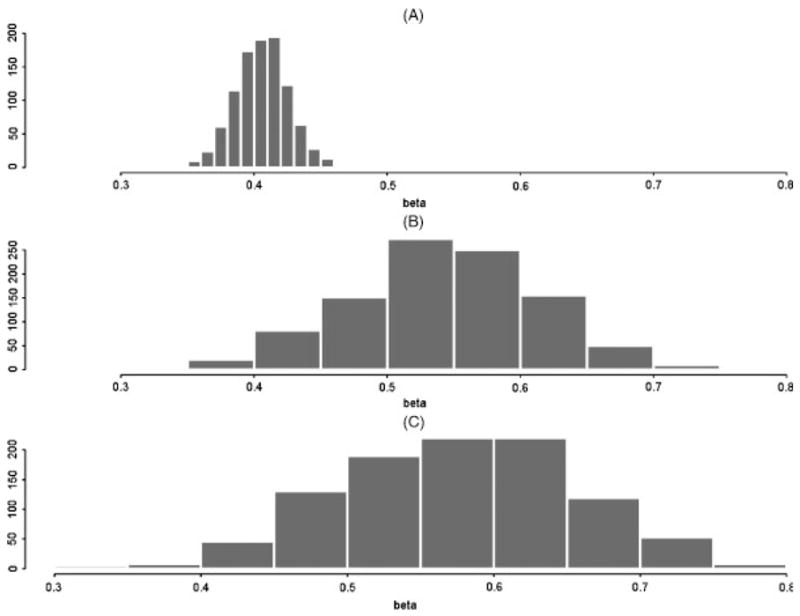
(A) Simulated distribution of mle β̂ from the full retrospective likelihood for pedigrees with four full sibs; simulations centered about the true, β = 0.405. (B) Simulated distribution of mle β̂ from the composite likelihood for four full sibs and (C) pairs of cousins. Results show upward bias of naïve composite likelihood over true β = 0.405.