
Fig. 2.
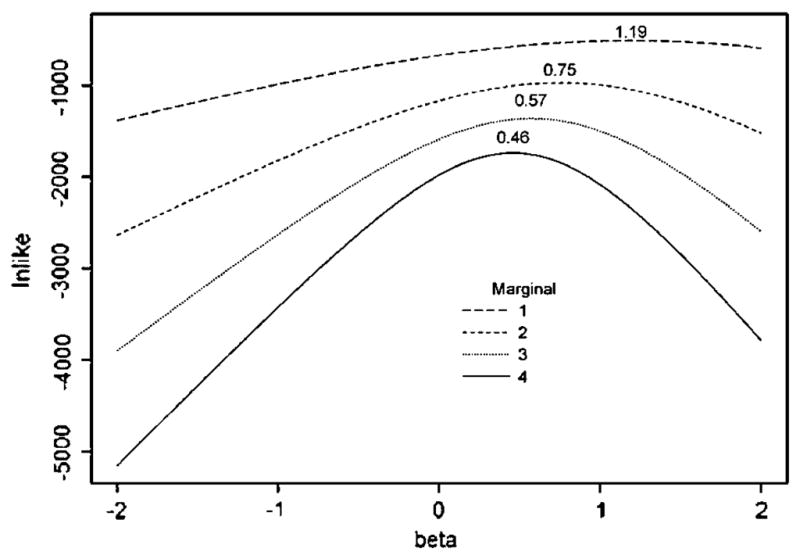
Full retrospective likelihood for simulated data for 4 affecteds sibs, and then “stepped-down” on the same data to naïve marginals for 3, 2, and 1 affected sibs. The mle β̂, printed above each marginal likelihood, is shown to be upward biased over the true simulating value of β = 0.405, with bias increasing as fewer affected subjects are used for an incorrect marginal likelihood.