
Fig. 5.
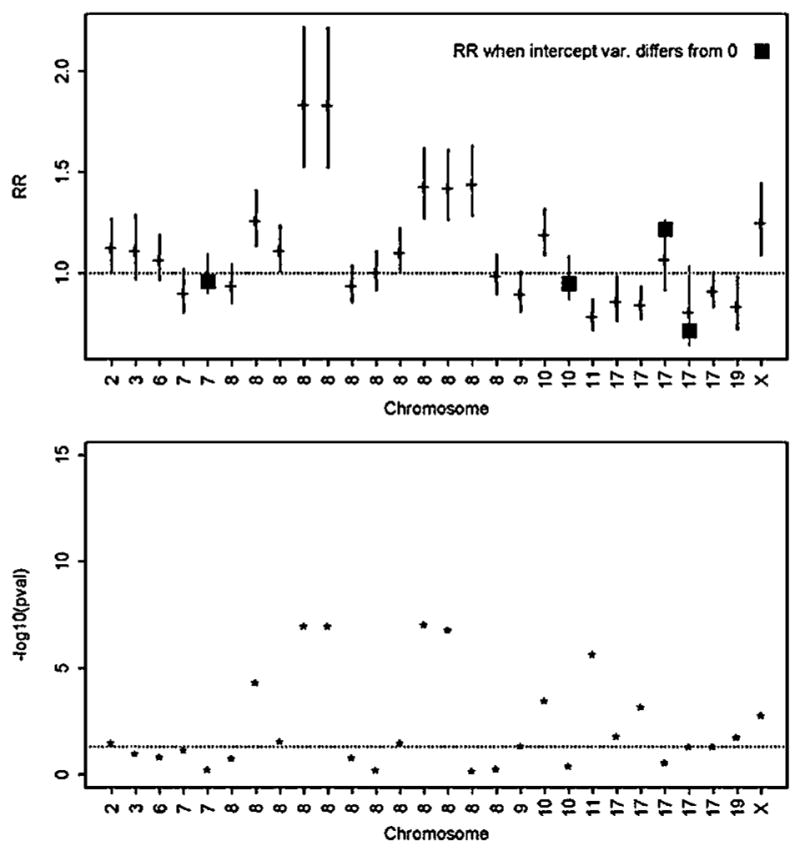
Results from fitting the retrospective likelihood to the Mayo Clinic pedigrees for 28 SNPs reported to be associated with prostate cancer. The upper panel illustrates the mle of the per-allele relative risk (eβ̂) and its 95% confidence interval. For four SNPs, the variance of the baseline risk was estimated to be non-zero; for these four SNPs the mle that accounts for heterogeneity is depicted as a black square. The lower panel is the −log10 (P-value) from the likelihood ratio test of the null hypothesis Ho: β = 0.