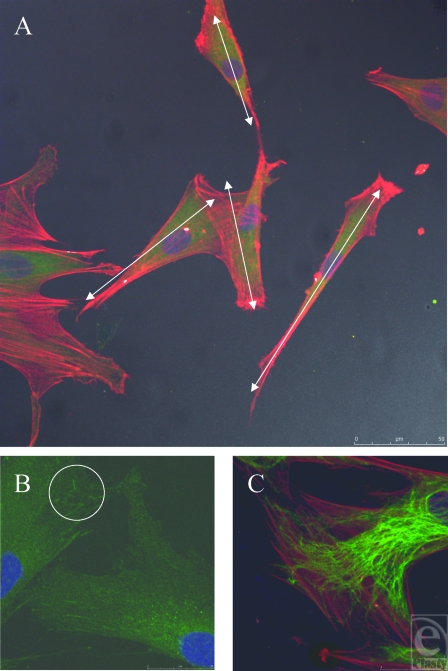
Figure 8.
Smooth control surface. (A) Fibroblasts randomly align in multiple directions. White arrows show differing polarities of fibroblasts. Actin fibers (red) and vimentin (green). (B) Vinculin (green) stained focal adhesion plaques highlighted in white circle, illustrating the point of contact between fibroblast and underlying surface. (C) Actin filaments and intermediate fibers have different directions within one cell. Actin fibers (red) and vimentin (green).

