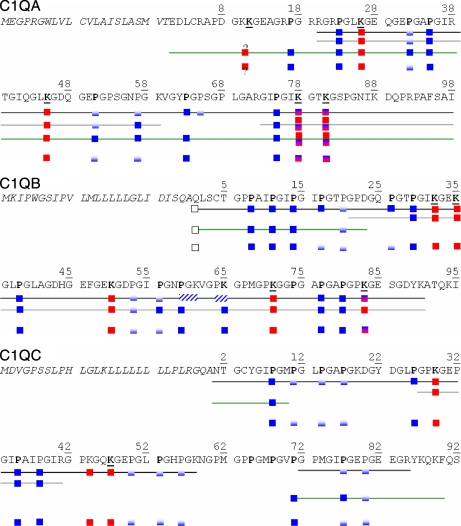
Fig. 3.
Summary of post-translational modifications determined by bottom-up and top-down analyses of CLR and C1q samples. Black line, identifications from MS2 data; gray line, identification from MS3 data; green line, identification from top-down data; no line, merged information on PTMs from bottom-up and top-down analyses. Fully blue squares, residue always detected as hydroxylated; blue/white squares, residue detected either as unmodified or hydroxylated, indicating partial modification; red squares, lysine always detected in a glycosylated form; red/blue squares, lysine detected either as glycosylated or hydroxylated. ? indicates that ambiguity remains as to whether Lys10 or Lys11 of C1q A is glycosylated.

