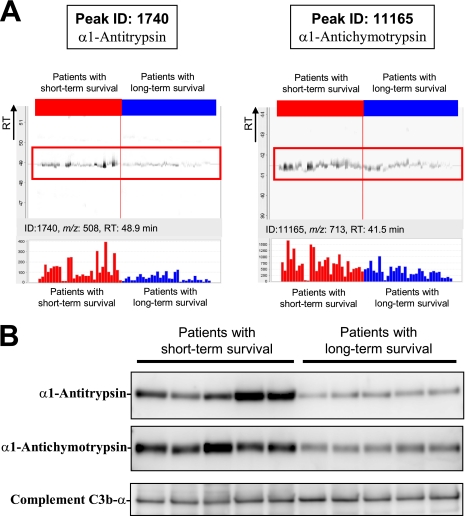
Fig. 2.
A, representative MS peaks in 60 triplicate LC-MS runs (29 with short term survival (red) and 31 with long term survival (blue)) aligned along the retention time (RT) of LC. Columns represent the mean intensity of triplicates (bottom). B, detection of α1-antitrypsin, α1-antichymotrypsin, and complement C3b-α (loading control) by immunoblotting.

