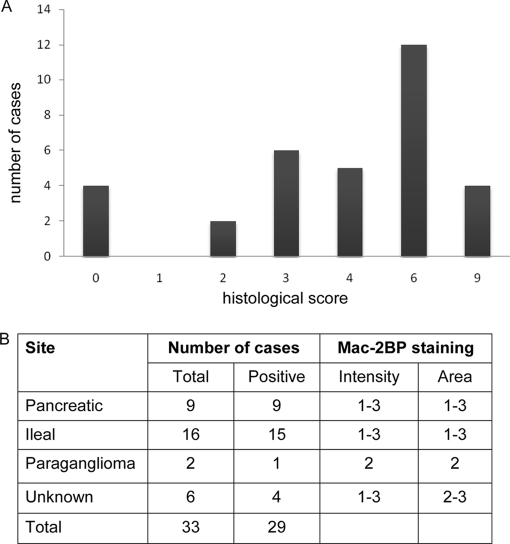
Fig. 4.
Immunohistochemical analysis of Mac-2BP expression in NET tissue. A, tumor samples from a panel of different NET types were scored according to the intensity of immunohistochemical staining for Mac-2BP (histological score). B, details of the intensity and scoring ranges are shown for each NET type, showing the number of cases in total; the number of cases with positive uptake (i.e. score >2); the intensity scored on a scale of 1–3 where 1 = weak, 2 = moderate, and 3 = intense; and the area scored on a range of 1–3 where 1 = <25%, 2 = 25–75%, and 3 = >75% positively stained.

