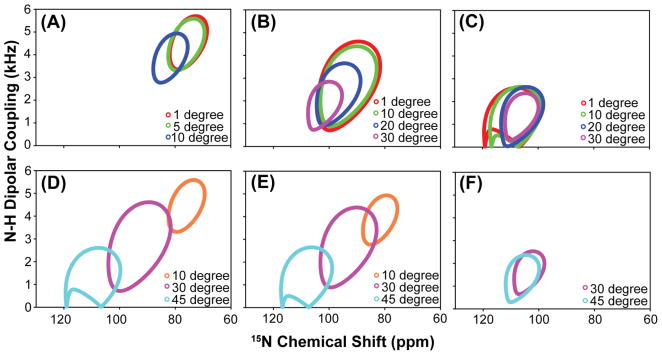
Figure 10. A series of helical wheels simulated using the proposed model for cytochrome b5 associated with bicelles.
(A–C) A series of helical wheels simulated with different degree of helical tilt angle fluctuations (σ), while keeping the average tilt (β0) of the helix constant. The average tilt angles (β0) used in the helical wheel simulations in figure 9(A)–9(C) are 10°, 30°, and 45°. (D–F) A series of helical wheels simulated with different degree of helical tilt angles (β0), while keeping the helical fluctuation (σ) constant. The constant helical fluctuation (σ) used in the helical wheel simulations in figures 9(D)–9(F) are 5°, 10°, and 30° and the helical tilt angles (β0) varies from 10°, 30°, and 45° in each of the figures 9(D)–9(F). (Note: If the helical fluctuation is greater than the average helical tilt, it represents an unrealistic situation and was excluded from simulations.)

