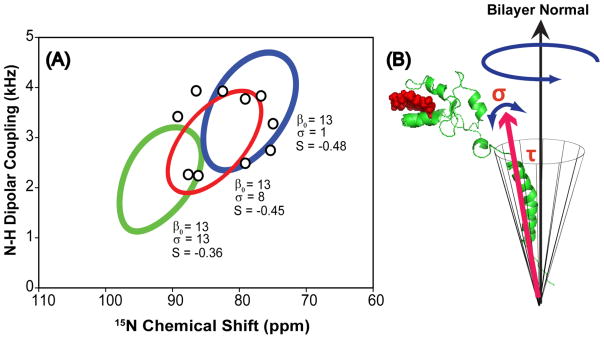
Figure 9.
(A) The fitting of the helical wheel pattern of resonances using the diffusion in a cone model. The open circles (○) denote the position of the observed resonances. The three PISA wheel fits were obtained using an average tilt angle of τ = 13° and a chosen value of σ. In this case, the chosen values of sigma are 1°, 8°, and 16° as indicated in the figure. (B) A diagram showing the wobbling motion of the helix in a lipid bilayer; where τ represents the tilt angle and σ represents the degree of fluctuation in the director axis.

