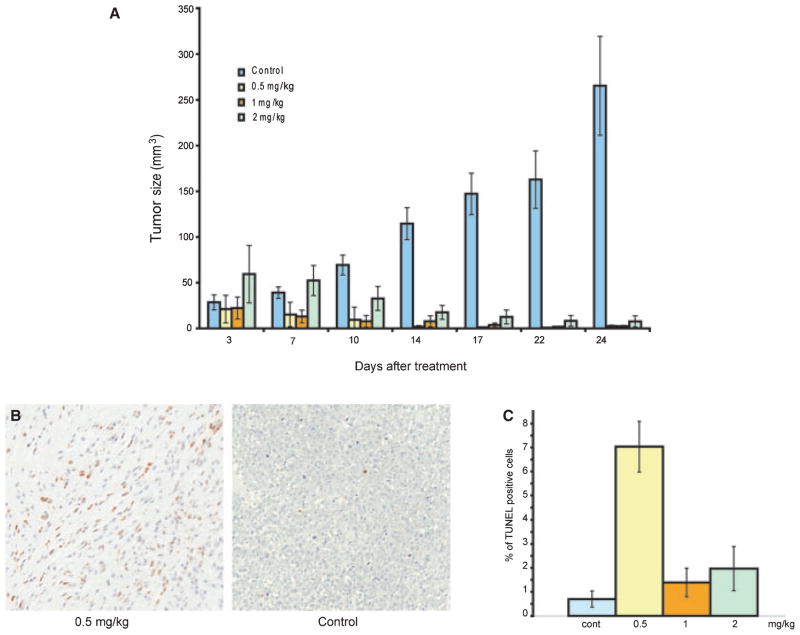
Figure 5.
BI-69A11 causes regression of melanoma tumors. (A) Nude mice were subcutaneously injected with UACC903 cells and tumors were allowed to reach an approximate size of 1 mm3 before intra-peritoneal treatment was started; treatment was performed twice per week for 3 weeks with the indicated concentrations of BI-69A11. Each of the experimental groups consisted of 10 mice that were subjected to treatment with the indicated concentration of BI-69A11. Half of the animals were injected with tumor cells, and half with the control solution. Tumors were measured with calipers at the indicated time points. The mice were sacrificed and tumors harvested at the end of this period were measured and weighed to determine tumor volume and mass. Blue bars represent control-vehicle treated group; yellow bars represent the 0.5 mg/kg treatment group; the orange and green bars represent the 1 and 2 mg/kg treatment groups, respectively. (B) Analysis of cell death in the tumors was performed using TUNEL staining. Shown are representative pictures for control tumors (right) and a treatment group (0.5 mg/kg; left). (C) Quantification of TUNEL staining in the different tumor groups. Samples from each of the tumors were subjected to TUNEL staining which was quantified by Aperio ImageScope and confirmed by visual inspection of representative samples. The % of Tunel positive cells is indicated in the graph. Blue bars represent control-vehicle treated group; yellow bars represent the 5 mg/kg treatment group; the orange and green bars represent the 1 and 2 mg/kg treatment groups, respectively.

