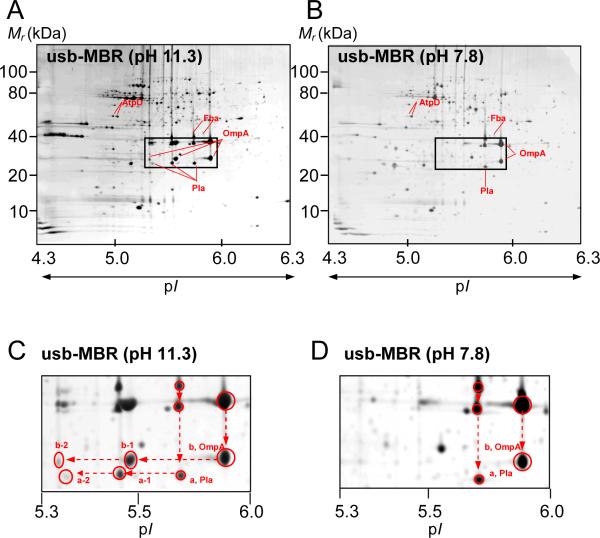
Figure 1.
Protein displays in 2-DE gels of Y. pestis KIM6+ membrane fractions isolated with (A,C) or without (B,D) extraction using an alkaline Na2CO3 solution. Circa 100 μg protein was loaded onto an IPG strip (24 cm, pH 4–7), separated in the first dimension, followed by SDS-PAGE (8–16%T) in the second dimension. Gels were stained with Commassie Brilliant Blue G-250. pI and molecular mass ranges for the profiled proteins are denoted. Magnified gel segments of the denoted rectangles in A and B are presented in C and D. The arrows indicate spots identified as OmpA and Pla. Vertical and horizontal spot trains for OmpA and Pla were reproduced in numerous 2-DE experiments.

