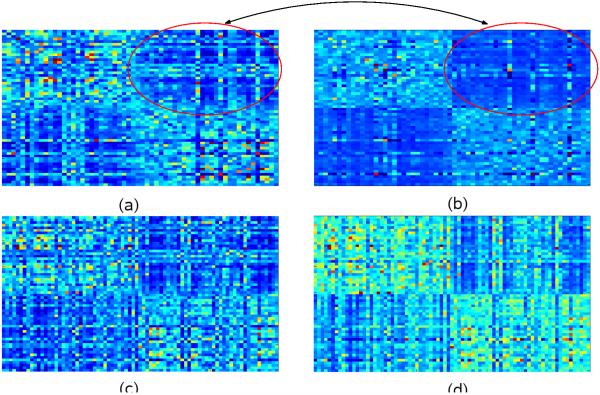
Fig. 2.
(a) Sum of base kernel matrices on training examples. (b) Robust-MKL kernel matrix between training examples. Note that the two classes are clearly visible, and the vertical and horizontal lines corresponding to outliers are attenuated. (c) Sum of base kernel matrices on test examples. (d) Robust-MKL kernel matrix between test examples. Notice that while there are vertical lines corresponding to outlier test examples, the horizontal lines remain largely attenuated.

