
Figure 1.
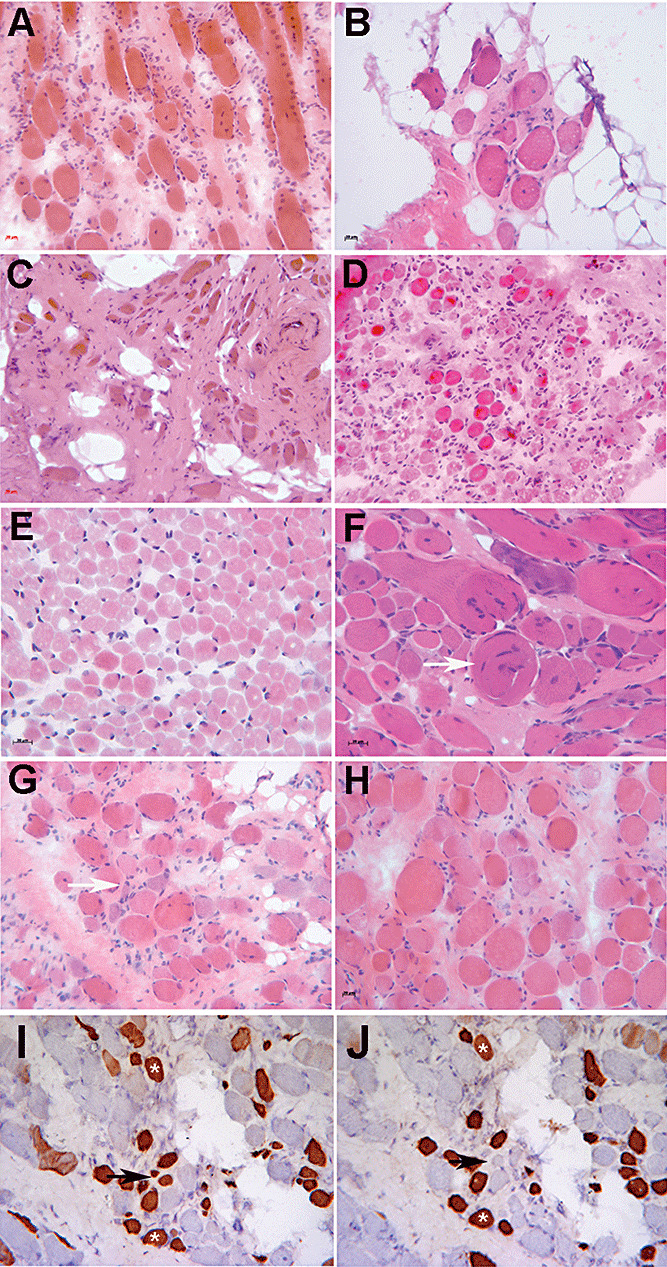
Illustrative images of the spectrum of pathology seen in this cohort of patients. Hematoxylin and eosin: A. P1. B. P2. C. P5. D. P8. E. P10. F. P3. G. P16. H. P9. Immunohistochemistry: I. P16, neonatal isoform of myosin heavy chain. J. P16, developmental isoform of myosin heavy chain. Scale bars represent 20 µm. White arrows in F and G point to whorled and basophilic fibers, respectively. Black arrows in I and J point to fibers that are positive for neonatal myosin but negative for developmental myosin, whereas other fibers are positive for both antibodies (asterisks).