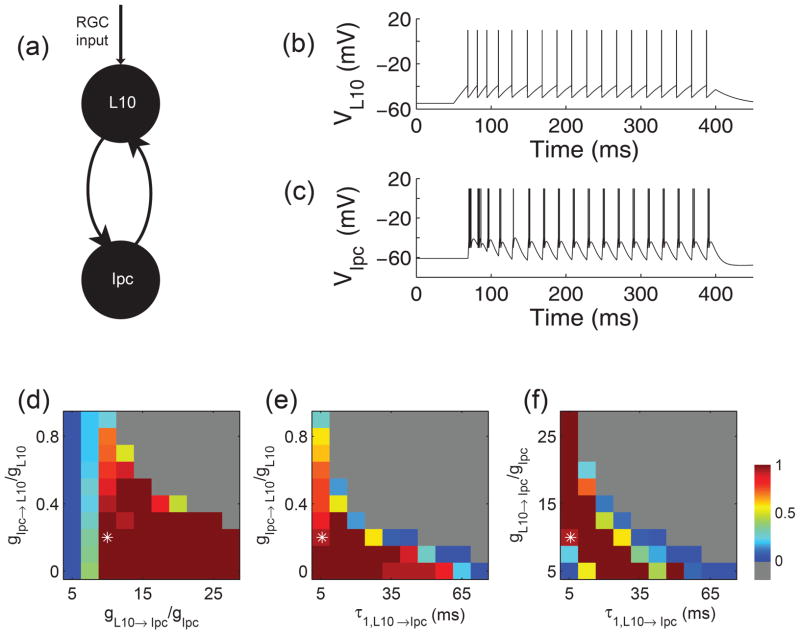
Fig. 5.
Generation of oscillatory bursting in a pair of model neurons with recurrent excitation. (a) Schematic drawing of the reciprocally coupled pair of L10 and Ipc model neurons with retinal (RGC) inputs to the L10 model neuron. (b) and (c) Responses of the reciprocally coupled L10 and Ipc model neurons to depolarizing current injection into the L10 model neuron. The injected current had a duration of 350 ms (starting at time = 50 ms) and an amplitude of 0.2 nA. The cellular and synaptic parameter values were chosen as described in the text and Table 1. The maximum synaptic conductances relative to the membrane conductance were gL10→Ipc/gIpc = 10 and gIpc→L10/gL10 = 0.2. The Ipc burst score (see Methods) for this trace equals14/15 ≅ 0.93. (d), (e), (f) Ipc responses for three cross sections through the 3-dimensional parameter space spanned by the maximum synaptic conductances gL10→Ipc/gIpc and gIpc→L10/gL10, and by the feedforward synaptic fall times τ1,L10→Ipc. The three cross sections intersect the point (asterisk) 10, 0.2, 5.6 ms, respectively, which is also the parameter set chosen for the sample trace in (b) and (c). The Ipc responses are represented in pseudo color by the burst score. When all spikes belong to bursts the score is 1 (red), when all spikes are isolated the score is 0 (blue), when the firing rate exceeds 1000 Hz the Ipc response is classified as diverging (gray).

