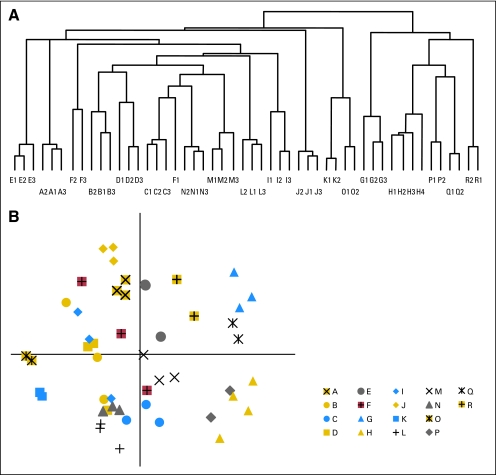
Fig 2.
Unsupervised clustering demonstrates that replicate samples have similar global patterns of expression. (A) Pearson Correlation Coefficient–based hierarchical clustering shows complete segregation of replicates in 17 of 18 patients and is confirmed by (B) a scatter plot of the top two principal components of all expressed genes. The discordant patient, F, is highlighted in red. Principal component 1 captures estrogen receptor status.

