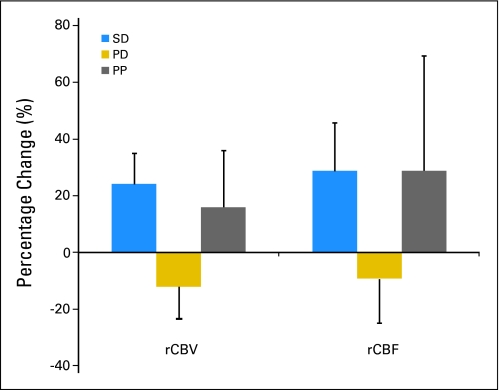
Fig 2.
Percent change of relative cerebral blood volume (rCBV) and blood flow (rCBF) 3 weeks after treatment initiation compared with pretreatment values is shown for the entire group (N = 27). Data are presented as mean ± SEM. Statistical significance was assessed at P < .0083 using an analysis of variance and Bonferonni posthoc test for multiple comparisons. SD, stable disease; PD, progressive disease; PP, pseudoprogression.

