
Figure 3.
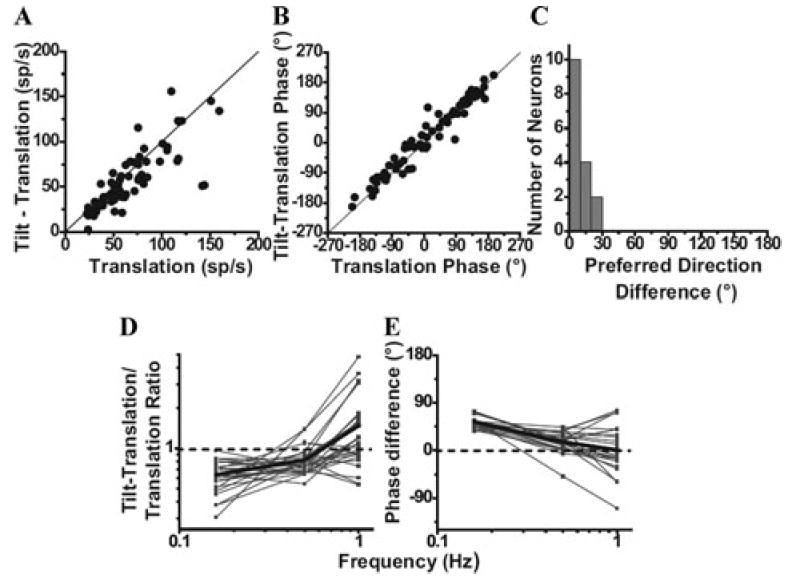
Spatio-temporal matching of canal-driven and otolith-driven signal contributions to NU Purkinje cell firing. (A), (B) Response amplitude and phase during the 0.5 Hz Tilt −Translation stimulus (canal-driven response) is plotted as a function of the respective amplitude and phase during Translation (otolith-driven response). (C) Distribution of the difference in preferred directions between the 0.5 Hz Tilt − “Translation and Translation responses. Data in A–C were replotted with permission from Yakusheva et al.29 (D), (E) Dependence of the relationship between otolith and canal-driven responses on frequency. (D) plots the ratio of peak response modulation during Tilt − Translation (canal-driven response) relative to that during Translation (otolith-driven response) as a function of frequency. (E) plots the phase difference between the response modulation during Tilt − Translation and Translation as a function of frequency. Thin lines and symbols illustrate data from single neurons, whereas thick lines indicate population averages. Data in D–E were replotted with permission from Yakusheva et al.,30 © Journal of Neuroscience.