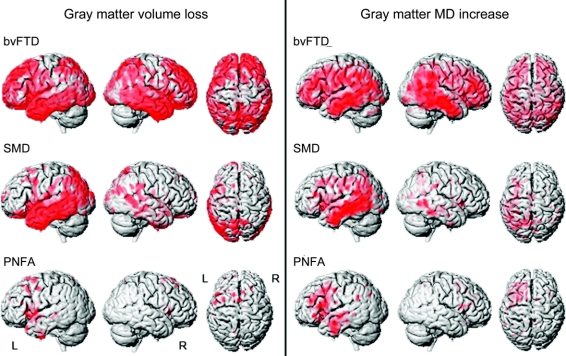
Figure 2 Patterns of gray matter loss and mean diffusivity increase using statistical parametric mapping
Three-dimensional renderings of the brain showing the patterns of gray matter loss (left) and patterns of mean diffusivity (MD) increase (right) in behavioral variant frontotemporal dementia (bvFTD), semantic dementia (SMD), and progressive nonfluent aphasia (PNFA) groups compared with controls. Results are shown uncorrected for multiple comparisons at p < 0.001.

